Introduction
My kid is a fan of The IT Crowd, so it didn't surprise me when I received the following bug report:Hey Dad. My computer was acting funny. So, I just turned it off for awhile. Just letting you know.My kid's desktop runs the following servers to collect and export machine measurements:
- collectd
- Prometheus Collectd Exporter
On another machine, I run Prometheus to collect, store, and analyze my measurements. I wondered if I can use Prometheus debug what happened.
Up or Down
I would like to learn when the machine got turned off. Prometheus uses HTTP to collect metrics from the target machine. If Prometheus can finish this scrape, it stores a 1 in a time series named UP -- a failed scrape will get a value of 0. I learned two things:- The computer was turned off at 02:00.
- The computer failed a scrape two hours earlier! This means Prometheus was unable to use http to collect metrics from the Collectd Exporter target. Very odd.
Dashboard
I customized the existing prometheus console templates to work with collectd's plugins. This makes it easier to view the common machine metrics in one spot. I discovered the following from that machine's dashboard:- At one point, all the CPU and RAM were in use -- this was when the Prometheus HTTP scrape failed.
- The machine went idle for two hours.
- There was a spike before the machine was powered off. I am guessing my kid used the soft power off button and didn't unplug the computer from the power outlet.
Guessing
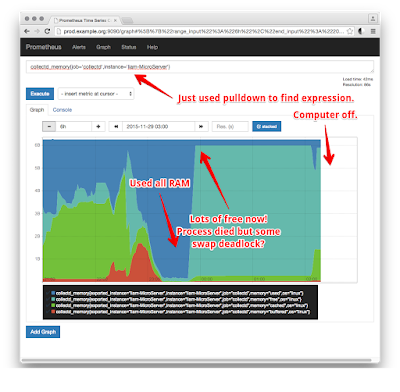
At this point, I used the expression browser to hunt for another collectd metric. I discovered that the whole swap partition was in use:It looks like my kid used all the RAM and swap. Afterwards the system didn't recover. Not sure if that was a kernel issue or just regular userland ENOMEM kinda bugs. I asked him what he was doing -- he said "changing settings to make a game go faster".


